Problem statement: unseen faults hurt availability
Operators say the grid looks fine until it isn’t. Small faults on the controller area network cause slow degradation: missed islanding tests, delayed inverter commands, silent battery failures. A proper observability plan begins by treating monitoring as an engineering problem, not an afterthought. Use a local microgrid controller for raw telematics and pair it with a smart microgrid controller with CAN to capture bus-level health and message diagnostics. From eight years of field work, and a utility pilot in Tainan that deployed CAN-equipped controllers, the recurring pattern is clear: missing CAN errors explain many “mystery” outages.
Core monitoring goals
Define three measurable goals. Each goal directs what you log and how you alert.
- Availability: percent uptime of control plane and DERs, measured per hour and per day.
- Responsiveness: command latency from controller to DER, and CAN bus arbitration delays.
- Correctness: successful islanding, charge/discharge adherence, and power-quality limits (voltage, frequency, THD).
Essential metrics to collect
Collect these metrics at device and network layer. They are minimal and actionable.
- Uptime and MTTR/MTBF for controller hardware and gateway devices.
- CAN bus statistics: error frames, arbitration retries, bus load percentage, and message drop counts.
- Command round-trip latency and jitter (ms).
- Battery state-of-charge, cycle count, charge/discharge current and temperature.
- Power metrics: real/reactive power, voltage, frequency, and THD per feeder.
- Firmware and configuration versions with checksum verification.
- Security events: failed auth attempts, unexpected configuration changes.
How to collect data reliably
Log locally first. Gateways bridge CAN to higher-level protocols. Capture raw CAN frames and aggregate summaries. Timestamp at source. Use deterministic sampling for high-frequency signals and sparse sampling for slow-changing state. That means:
- Edge logger storing circular buffer of raw frames for forensic recovery.
- Periodic exports of aggregated counters (every 1–5 minutes) to central telemetry.
- Time synchronization across devices (PTP or NTP with monitoring of offset).
- Protocol bridges that translate CAN diagnostics into MQTT or HTTP without losing error-frame context.
Analysis, thresholds, and alerting
Create rules that reflect physical reality, not arbitrary limits. Use rolling baselines and simple statistical checks first. Example rules that stop incidents early:
- Raise warning when CAN bus load > 70% sustained for 5 minutes; critical if retries spike concurrently.
- Alert when command round-trip latency exceeds 200 ms or when jitter exceeds baseline by 3×.
- Flag any firmware mismatch between controller and DER or checksum failures immediately.
- Escalate when islanding test fails twice in a 24-hour window.
Keep alerts actionable: each alert must point to a single next step—inspect CAN logs, check gateway CPU, or revert firmware.
Common pitfalls and quick fixes
Teams repeat the same mistakes. Fixes are straightforward.
- Pitfall: trusting averaged metrics. Fix: keep high-resolution raw buffers for at least 72 hours.
- Pitfall: unsynchronized clocks. Fix: enforce PTP or monitored NTP; include offset in logs.
- Pitfall: overloaded CAN bus after adding new messages. Fix: review bus schedule, reduce nonessential frames, or add segmentation/load balancing.
- Pitfall: silent firmware drift. Fix: automated version checks and safe rollback path.
- Pitfall: noisy alarms. Fix: tune thresholds with histogram analysis and implement suppression windows for known transient events.
Implementation checklist
Follow these steps to move from concept to stable monitoring.
- Install edge logger on controller; enable raw CAN frame capture with circular buffer.
- Publish aggregated metrics to central collector every 1–5 minutes; include error counters and latency percentiles.
- Set three alert tiers (warning, critical, emergency) and attach remediation action for each.
- Run controlled islanding tests weekly and log results automatically.
- Perform quarterly integrity checks: firmware checksum audit, CAN bus load study, and power-quality baseline update.
Synthesis and practical outcome
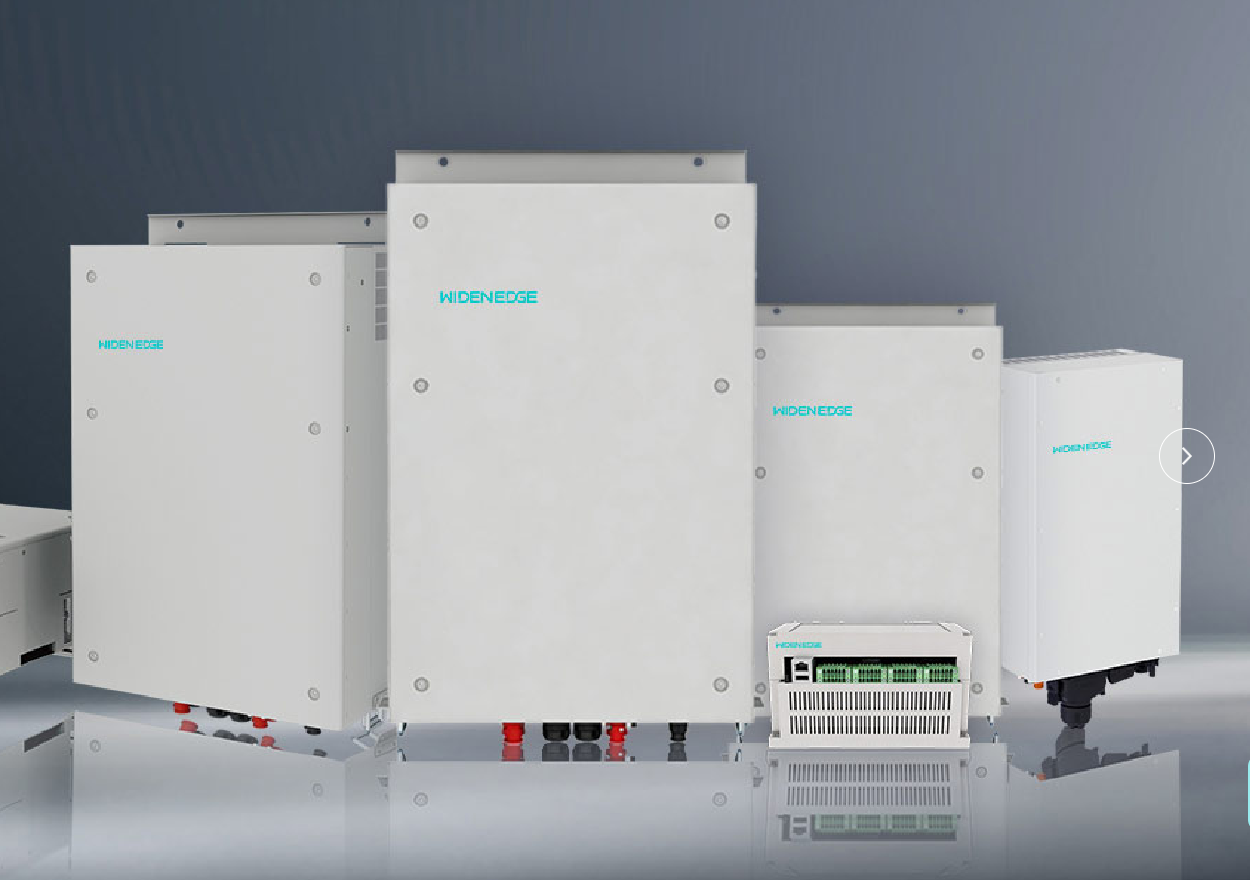
Solve monitoring by making CAN health visible, aligning alerts to concrete fixes, and keeping raw data available for forensics. When the controller, network, and analytics share the same definitions, teams fix root causes instead of chasing symptoms—fewer surprise outages, shorter repairs, clearer accountability. The workflow I describe maps directly to integration patterns used by WidenEdge, so operators can combine bus-level diagnostics with central analytics and see the problem before customers notice it.