

Data shows mixing failures cost manufacturers measurable output—typically 5–15% lost yield and up to 20% longer cycle times when the wrong topology is chosen—so I start with numbers, not slogans. A clear baseline (mixing time, energy per cubic meter, particle-size target) lets you compare options. For many formulators and process engineers that means evaluating industrial mixing solutions against measurable KPIs rather than brand claims.
Key performance metrics to quantify
Measure these six variables before vendor selection: mixing time to target (seconds or minutes), energy density (kW·h·m−3), shear rate range (s−1), torque at operating viscosity (Nm), coefficient of variation for the key property (CV, %), and heat-transfer delta-T under steady-state load. Typical targets: energy density 0.1–10 kW/m3 for low-viscosity blends; 10–1,000 kW/m3 for high-shear emulsification; CV <5% for commercial consistency. Record baseline runs at 25%, 50%, and 100% load to expose nonlinearity in power draw and mixing time.
Design trade-offs and selection logic
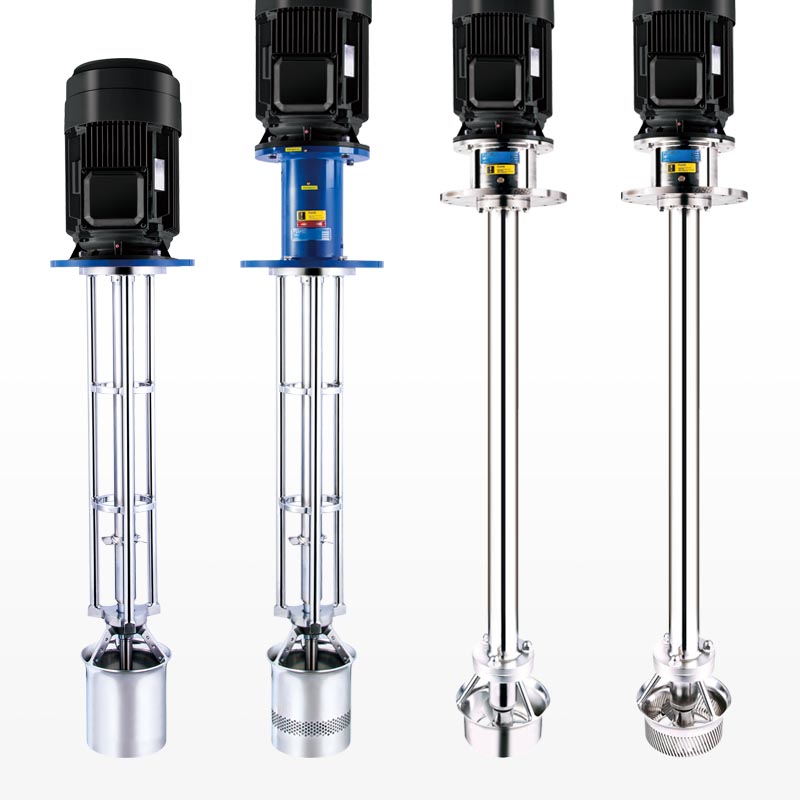
Data predicts which topology performs. Use these heuristics: impeller systems (anchor, turbine) minimize power per volume and scale well for Newtonian fluids; rotor–stator and high-pressure homogenizers deliver controlled droplet size for emulsions but carry higher specific energy. Inline mixers reduce floor space and deliver repeatable residence time distributions; batch systems offer flexibility for multiple SKUs. Evaluate tip speed, Reynolds number, and power number when scaling. Pick the smallest degree of shear that achieves your particle-size distribution to limit heat and degradation.
Common mistakes revealed by data
Engineers routinely err by sizing to peak lab performance rather than industrial throughput. Typical failure modes: undersized motor (overheating/torque spikes), insufficient clearances (blockage, cavitation), and neglecting CIP or material compatibility. Practical benchmarking often references equipment displayed at ACHEMA in Frankfurt; comparison tables and vendor specs for industrial mixing products confirm which rotor geometries and surface finishes were validated at scale. I’ve seen field trials where swapping a rotor profile reduced mixing time by 40% while cutting energy use 18%—measurements matter.
Alternatives and when each wins
Choose based on the metric matrix. If droplet size control <1 µm is critical, select high-pressure homogenizers. If shear-sensitive solids must stay intact, choose low-shear axial mixers. Static mixers win when continuous, low-maintenance blending is primary and pressure drop is acceptable. Ultrasonic or cavitation systems are niche: they excel at deagglomeration but add maintenance and acoustic shielding. Always map alternatives against throughput (kg·h−1), allowable residence time, and maintenance window hours per month.
Implementation checklist (data-driven)
Before procurement: 1) Define quantitative acceptance tests (mixing time, particle-size distribution, CV); 2) Require performance curves (power vs. viscosity, torque vs. speed); 3) Validate materials and surface finish for product chemistry; 4) Simulate scale-up with dimensionless numbers (Re, Po, tip speed); 5) Plan for cleaning and spare-part lead times; 6) Log baseline runs and set control limits for SPC. Execute run-to-run data capture from day one—without that, you can’t prove improvement.
Final synthesis
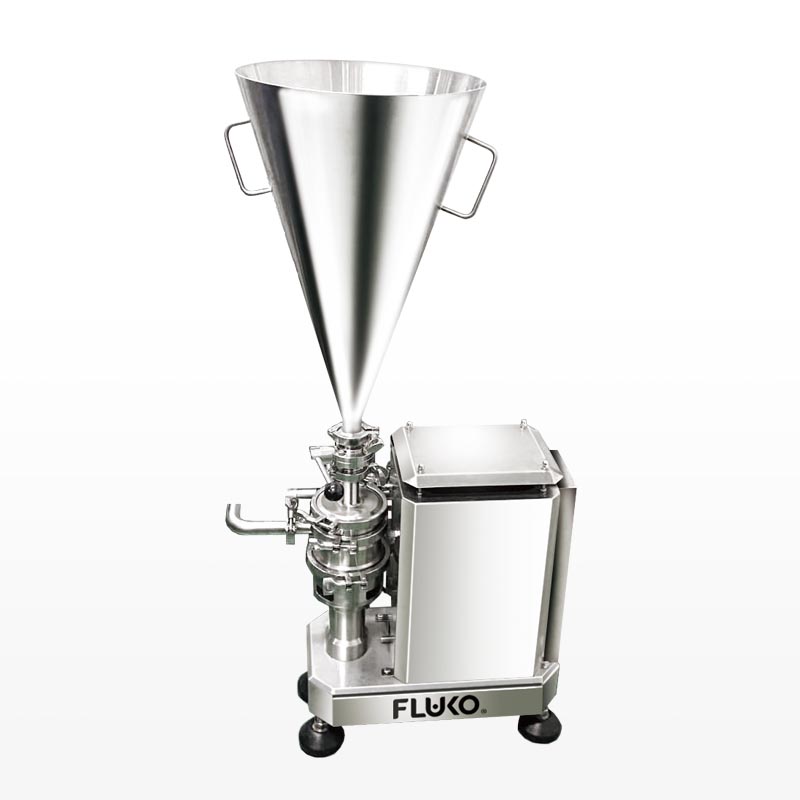
Data-driven selection turns subjective vendor comparisons into objective decisions: quantify what matters, benchmark under realistic loads, and choose the smallest shear footprint that meets quality targets. When throughput, repeatability, and maintainability line up against measured KPIs, the solution is clear and operationally verifiable, as embodied by FLUKO.